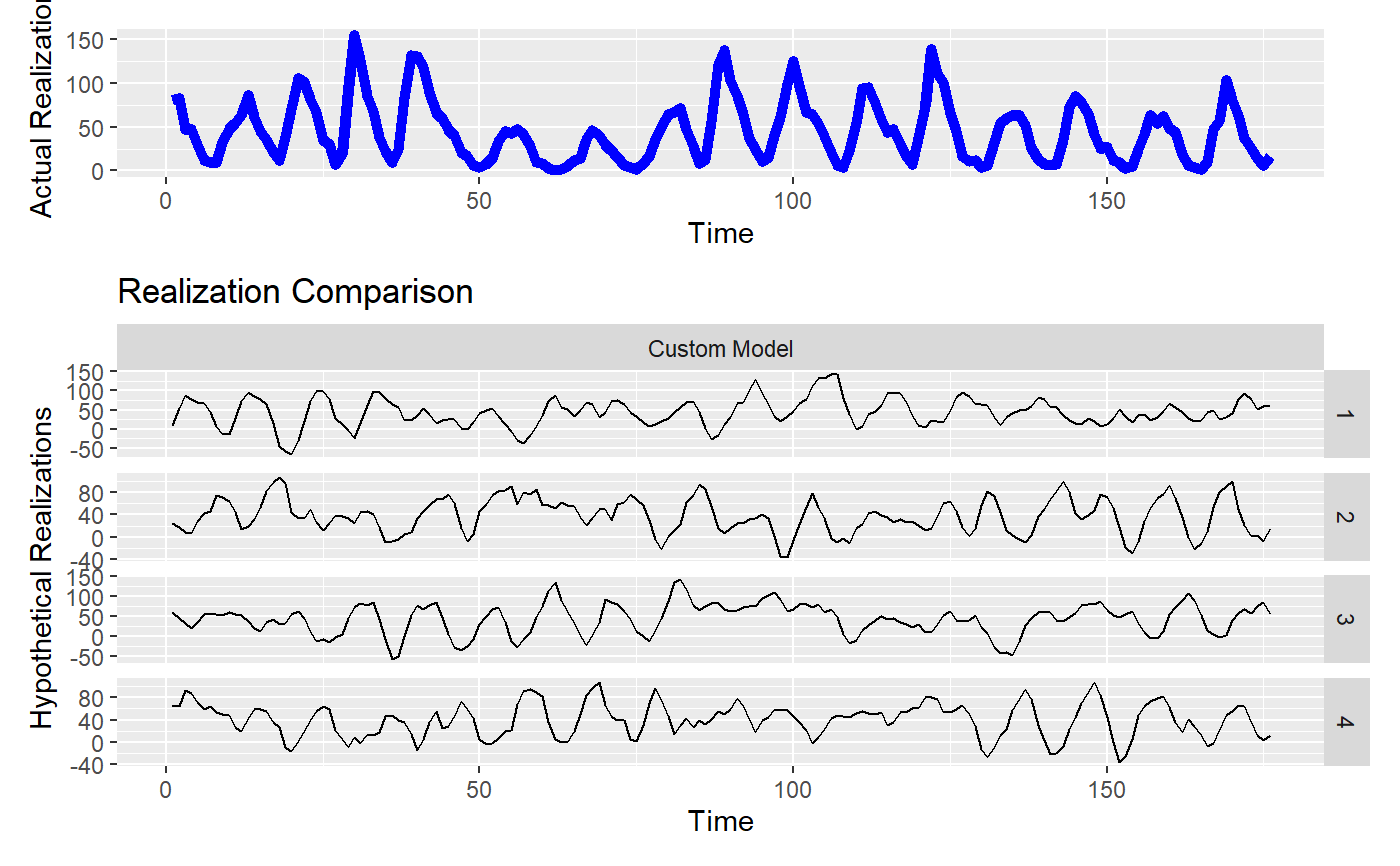
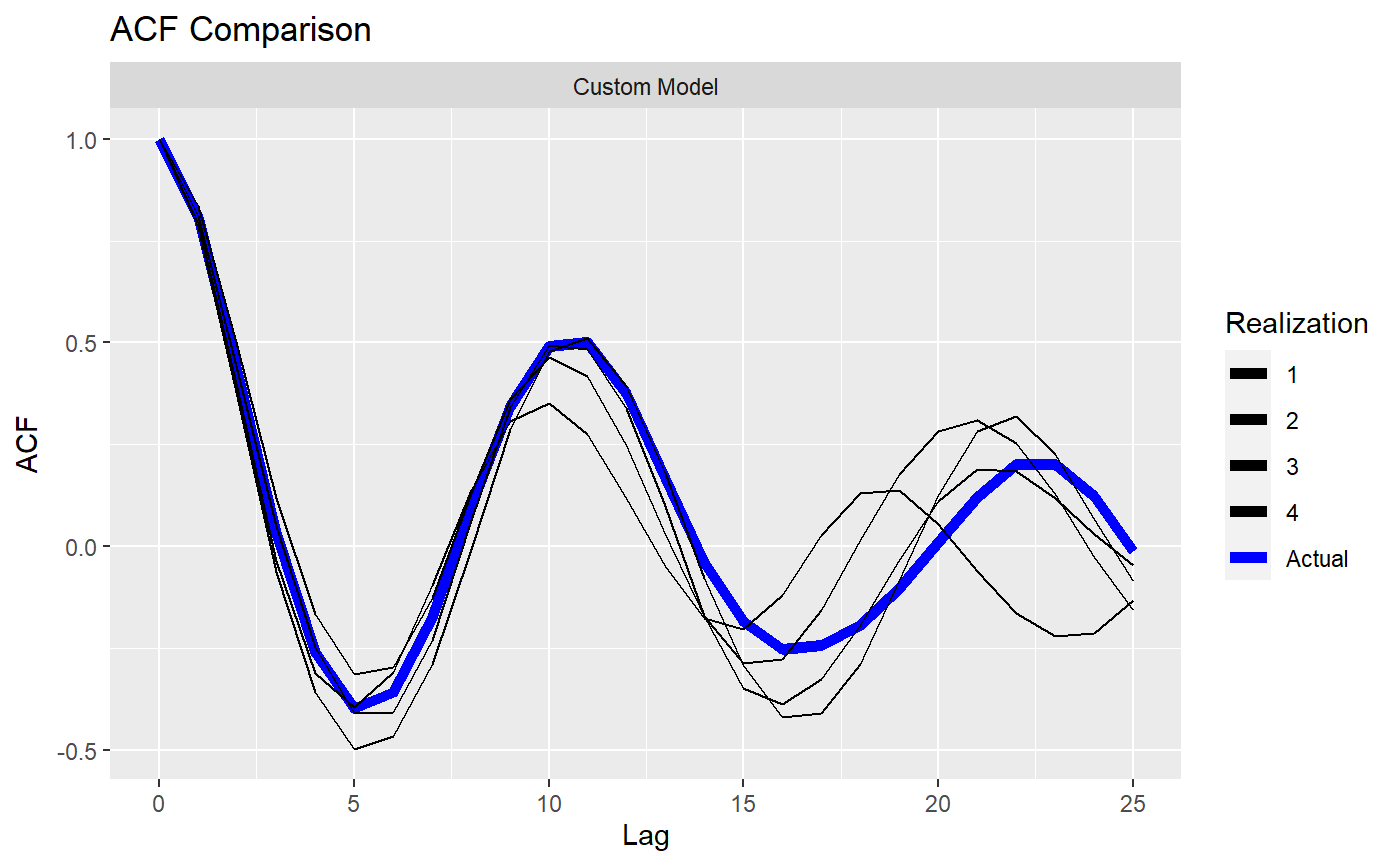
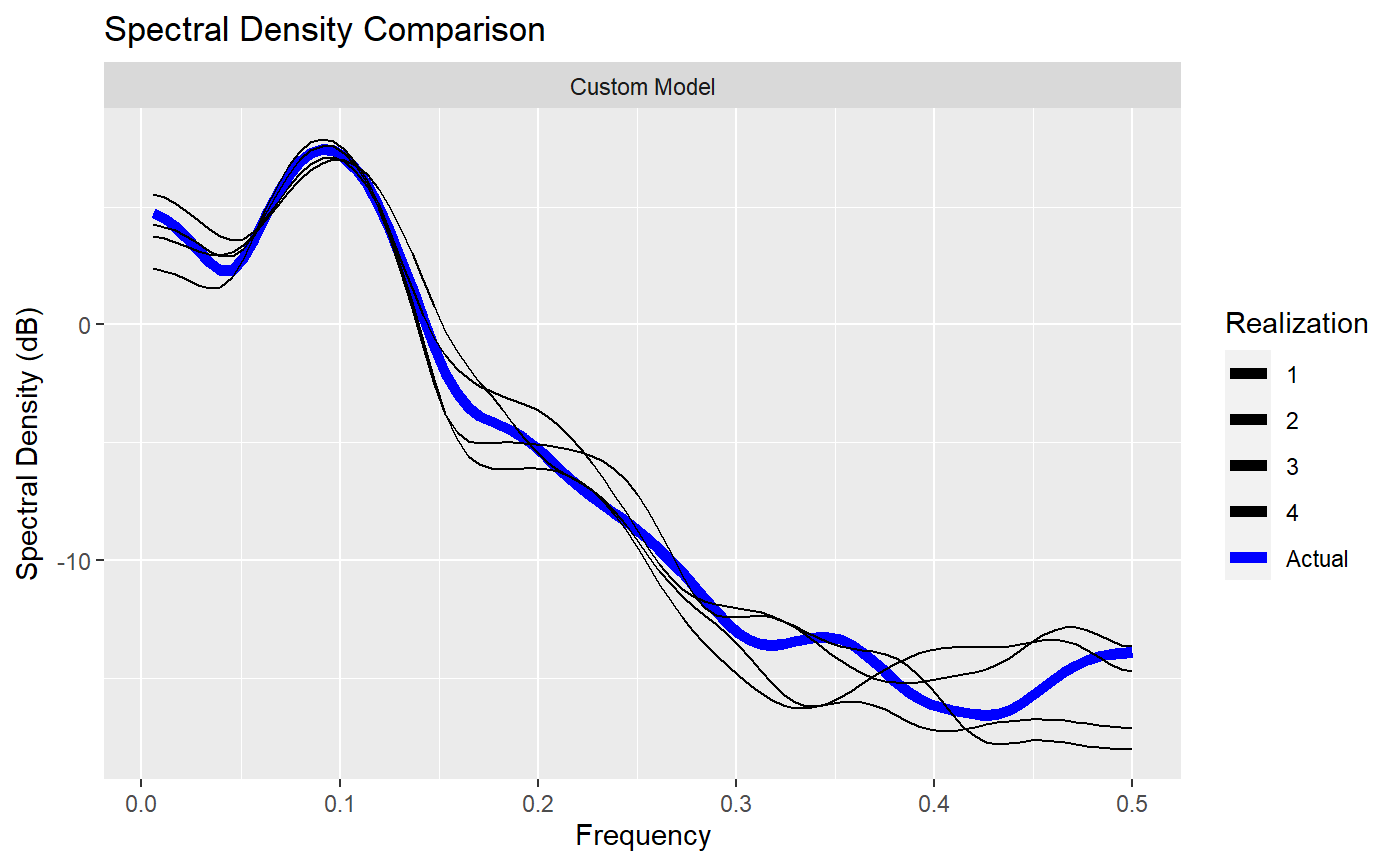
Plot multiple realizations of a model Useful for checking model appropriateness
plot_multiple_realizations.RdPlot multiple realizations of a model Useful for checking model appropriateness
plot_multiple_realizations(data, results, plot = c("all"), scales = "free_y")
Arguments
| data | The actual and the hypothetical realizations in tidy data format |
|---|---|
| results | The ACF and Spectral Density values for the actual and hypothetical realizations in tidy data format |
| plot | A vector of options to plot (Default = c("all")) Other options: 'realization', 'acf', 'spectrum' |
| scales | The scales argument to be passed to ggplot facet_wrap layer (Default = 'free_y') Other appropriate options: 'fixed' |
Examples
#> #> Coefficients of Original polynomial: #> 1.2287 -0.4733 -0.1381 0.1569 -0.1403 0.0705 -0.1284 0.2069 #> #> Factor Roots Abs Recip System Freq #> 1-1.5565B+0.8970B^2 0.8676+-0.6017i 0.9471 0.0965 #> 1-0.8771B 1.1402 0.8771 0.0000 #> 1-0.4147B+0.6550B^2 0.3166+-1.1944i 0.8093 0.2088 #> 1+0.7964B -1.2557 0.7964 0.5000 #> 1+0.8231B+0.5043B^2 -0.8161+-1.1476i 0.7101 0.3484 #> #>r = generate_multiple_realization(x = sunspot.classic, phi = est$phi, theta = est$theta, vara = est$avar, seed = 11) plot_multiple_realizations(data = r$data, results = r$results)