1.3.2 Compare nnfor::mlp() models
ModelCompareNNforCaret.RmdSetup Libraries
library(tswgewrapped)
Load Data
file = system.file("extdata", "USeconomic.csv", package = "tswgewrapped", mustWork = TRUE)
USeconomic = read.csv(file, header = TRUE, stringsAsFactors = FALSE, check.names = FALSE)
names(USeconomic) = gsub("[(|)]", "", colnames(USeconomic))
data = USeconomic
Build caret model
Since this process takes some time, I have commented this out for now and saved an already created caret model. However, feel free to uncomment this and run the model build process.
# library(caret)
#
# # Random Parallel
# model = ModelBuildNNforCaret$new(data = data, var_interest = "logGNP", m = 2,
#                                  search = 'random',
#                                  grid = NA, tuneLength = 2,
#                                  batch_size = 132, h = 2,
#                                  parallel = TRUE,
#                                  seed = 1,
#                                  verbose = 1)
#
# model$summarize_hyperparam_results()
# model$plot_hyperparam_results()
#
# model$summarize_best_hyperparams()
# model$summarize_build()
#
# caret_model = model$get_final_models(subset = 'a')
Load already saved caret model
file = system.file("extdata", "caret_model_batch_ase.rds", package = "tswgewrapped", mustWork = TRUE)
caret_model = readRDS(file)
Initialize the ModelCompareMultivariateVAR object
mdl_compare = ModelCompareNNforCaret$new(data = data, var_interest = 'logGNP',
                                         mdl_list = caret_model,
                                         verbose = 1)
#>
#> Computing metrics for:  reps15_hd5_sdetFALSE
#> Warning in private$models[[name]]$ASEs = res$ASEs: Coercing LHS to a list
#>
#> Computing metrics for:  reps19_hd2_sdetFALSE
#> Warning in private$models[[name]]$ASEs = res$ASEs: Coercing LHS to a list
#> NULL
Compare the models
Statistically Compare the models
mdl_compare$statistical_compare()
#>             Df    Sum Sq   Mean Sq F value Pr(>F)
#> Model        1 1.803e-08 1.803e-08    0.34  0.591
#> Residuals    4 2.121e-07 5.302e-08
#>
#>
#>   Tukey multiple comparisons of means
#>     95% family-wise confidence level
#>
#> Fit: aov(formula = ASE ~ Model, data = results)
#>
#> $Model
#>                                                    diff           lwr
#> reps19_hd2_sdetFALSE-reps15_hd5_sdetFALSE -0.0001096261 -0.0006316118
#>                                                    upr     p adj
#> reps19_hd2_sdetFALSE-reps15_hd5_sdetFALSE 0.0004123596 0.5911161
#> Call:
#>    aov(formula = ASE ~ Model, data = results)
#>
#> Terms:
#>                        Model    Residuals
#> Sum of Squares  1.802683e-08 2.120736e-07
#> Deg. of Freedom            1            4
#>
#> Residual standard error: 0.0002302572
#> Estimated effects may be unbalanced
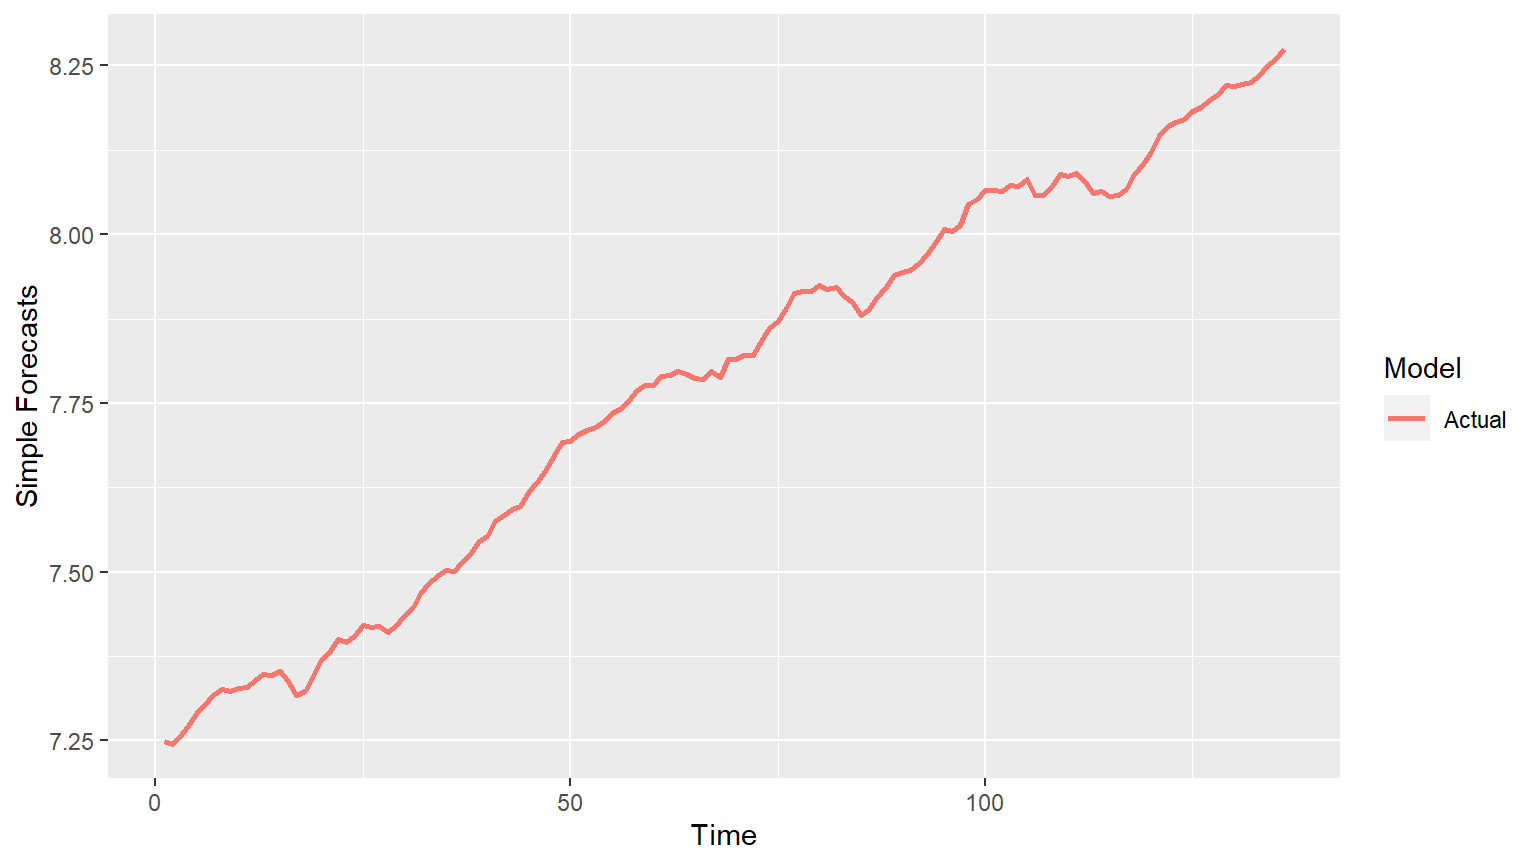
Simple Forecasts (with various options)
This is not currently supported since it needs future values to be passed and we dont have these values yet (unless we forecast them). We will add this functionality in the future.
p = mdl_compare$plot_simple_forecasts()
#> This function is not supported for nnfor::mlp at this time.
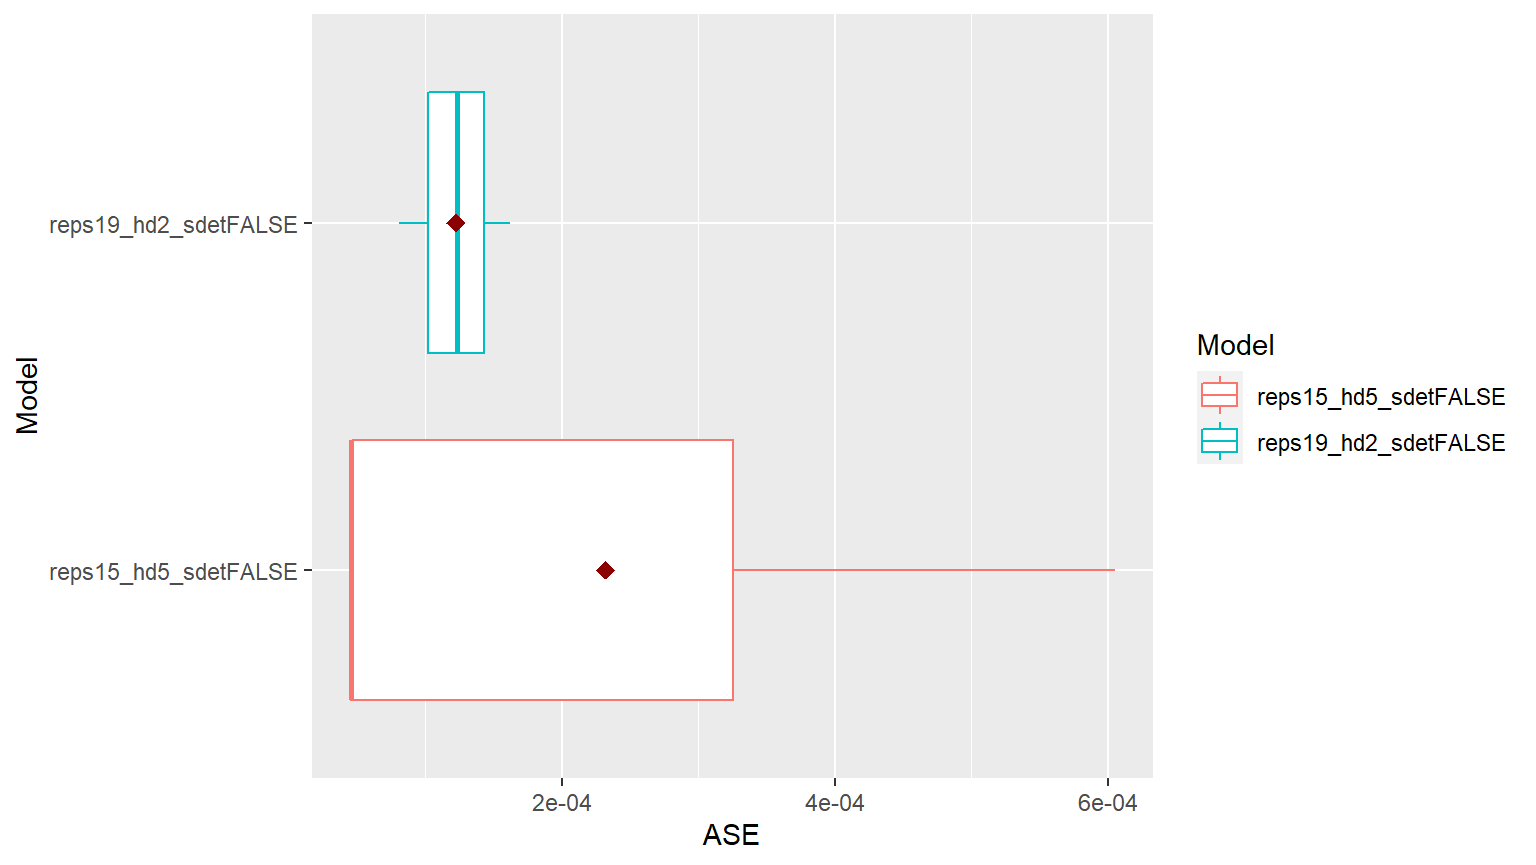
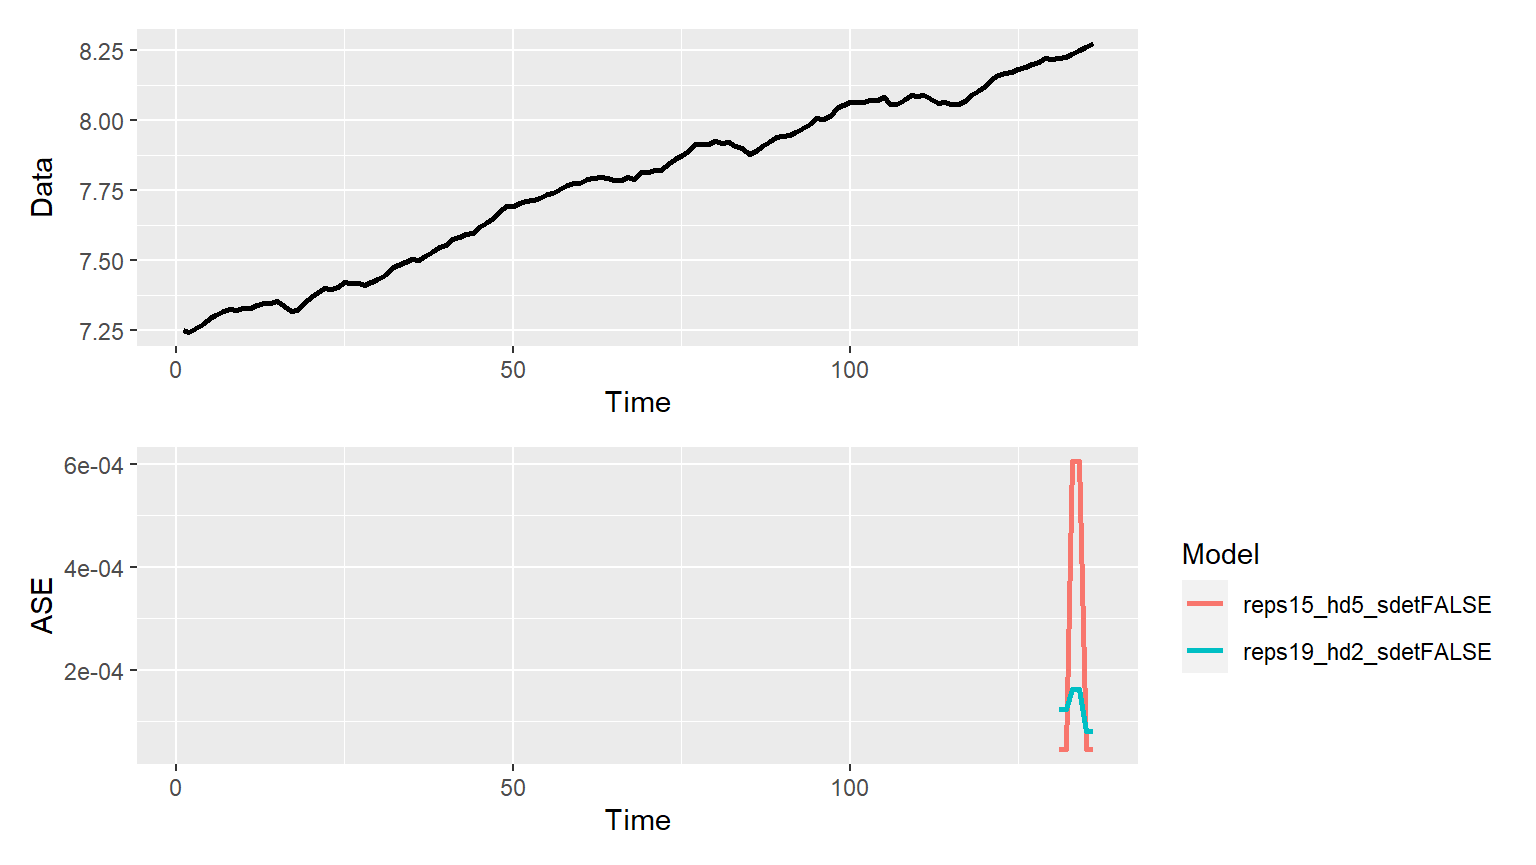
Plot and compare the ASEs per batch
p = mdl_compare$plot_batch_ases()
#> Loading required namespace: patchwork
#> Warning: Removed 260 row(s) containing missing values (geom_path).
Raw Data and Metrics
ASEs = mdl_compare$get_tabular_metrics(ases = TRUE) print(ASEs) #> # A tibble: 6 x 5 #> Model ASE Time_Test_Start Time_Test_End Batch #>#> 1 reps15_hd5_sdetFALSE 0.0000449 131 132 1 #> 2 reps15_hd5_sdetFALSE 0.000605 133 134 2 #> 3 reps15_hd5_sdetFALSE 0.0000461 135 136 3 #> 4 reps19_hd2_sdetFALSE 0.000124 131 132 1 #> 5 reps19_hd2_sdetFALSE 0.000163 133 134 2 #> 6 reps19_hd2_sdetFALSE 0.0000810 135 136 3
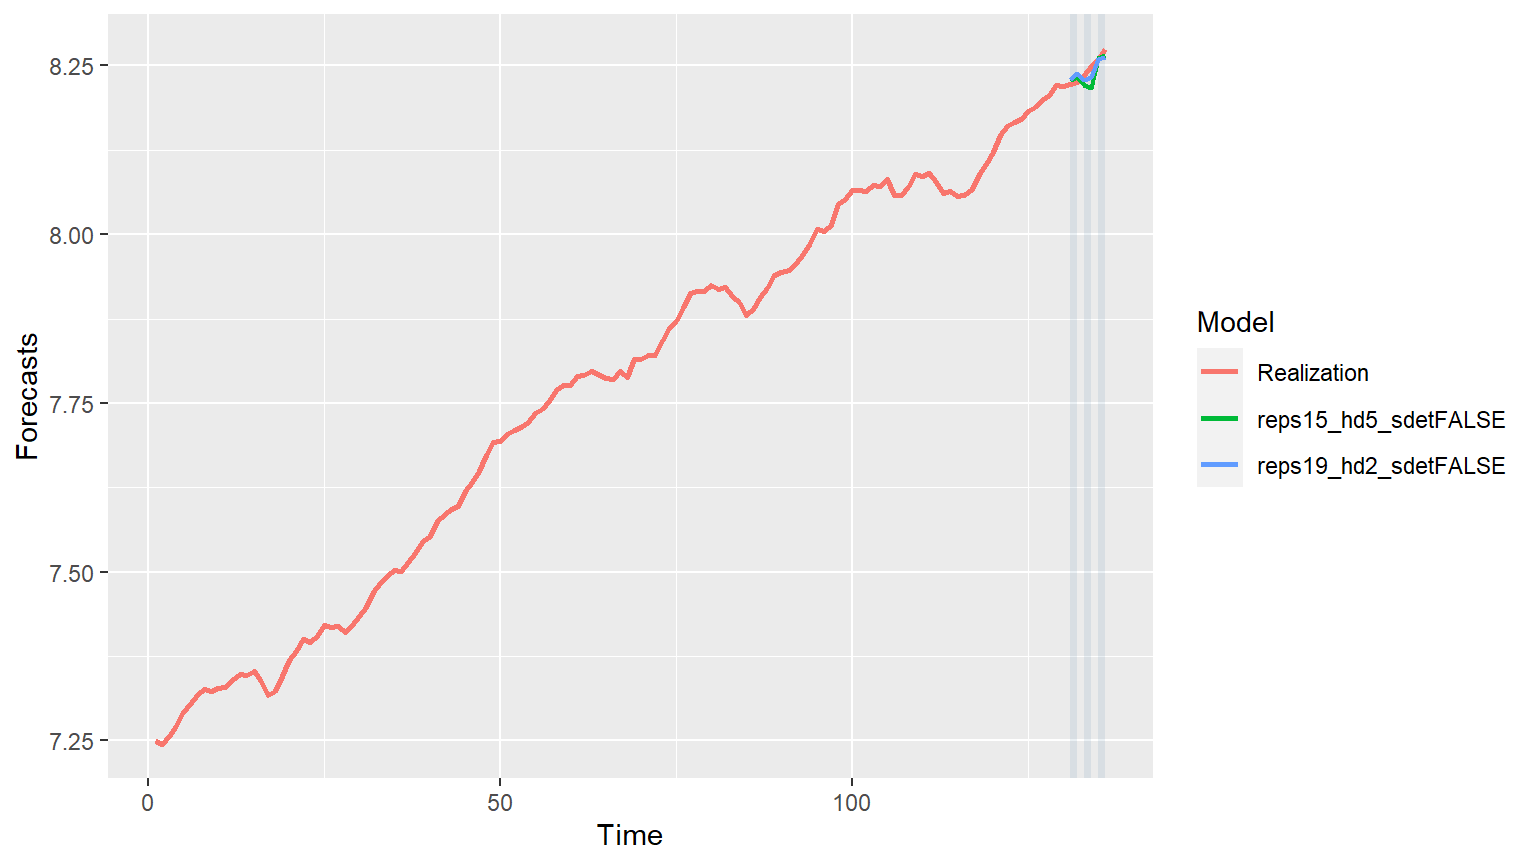
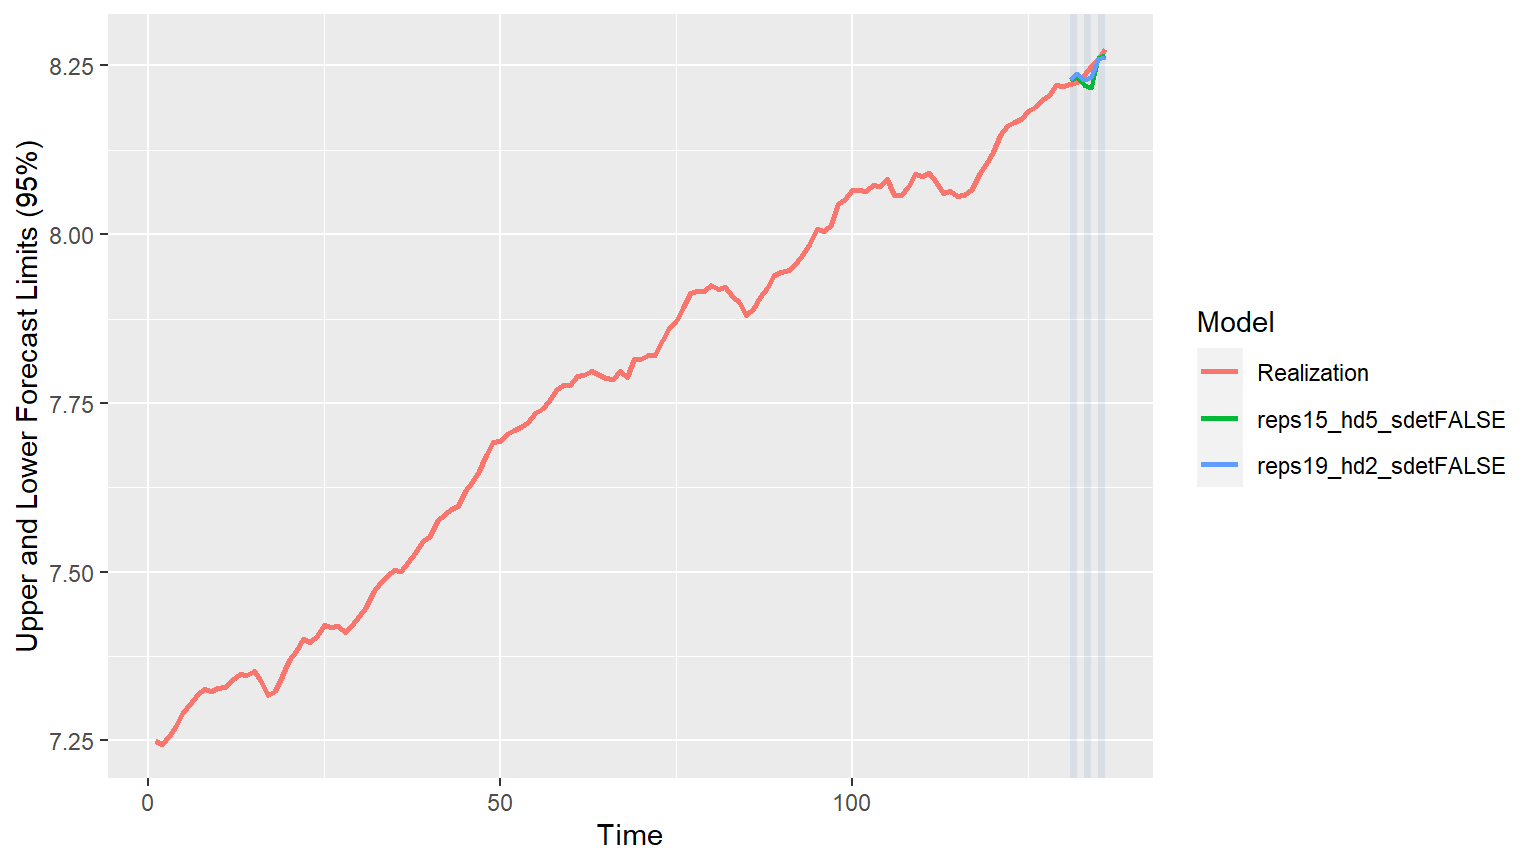
forecasts = mdl_compare$get_tabular_metrics(ases = FALSE) print(forecasts) #> # A tibble: 148 x 5 #> Model Time f ll ul #>#> 1 reps15_hd5_sdetFALSE 131 8.23 8.23 8.23 #> 2 reps15_hd5_sdetFALSE 132 8.23 8.23 8.23 #> 3 reps15_hd5_sdetFALSE 133 8.22 8.22 8.22 #> 4 reps15_hd5_sdetFALSE 134 8.22 8.22 8.22 #> 5 reps15_hd5_sdetFALSE 135 8.26 8.26 8.26 #> 6 reps15_hd5_sdetFALSE 136 8.27 8.27 8.27 #> 7 reps19_hd2_sdetFALSE 131 8.23 8.23 8.23 #> 8 reps19_hd2_sdetFALSE 132 8.24 8.24 8.24 #> 9 reps19_hd2_sdetFALSE 133 8.23 8.23 8.23 #> 10 reps19_hd2_sdetFALSE 134 8.23 8.23 8.23 #> # ... with 138 more rows